
- HYPOTHESIS TESTING
- Hypothesis testing is a statistical procedure used to evaluate evidence from a sample and determine whether it supports a specific claim about a population parameter.
- It provides an objective and structured framework for decision-making under uncertainty using probability theory.
- We require hypothesis testing to avoid conclusions driven by random variation and to generate scientifically valid and reproducible inferences.
- Its advantages include standardization, reproducibility, and quantifiable control of errors, although carefulness is essential because incorrect assumptions or inappropriate test selection can lead to misleading conclusions.
For example, if a hospital claims that the average recovery time for patients after a new physiotherapy treatment is 7 days, we use hypothesis testing to analyze past patient recovery records and check whether this claim is accurate or if the true average recovery time is different.
Importance of hypothesis testing
Hypothesis testing is widely used in medical and public health research. For example, it helps determine whether a new drug works better than an existing drug. In addition, it allows researchers to compare treatments, estimate disease risks, and understand relationships between variables. Because of these advantages, hypothesis testing is considered one of the core methods in evidence-based medicine.
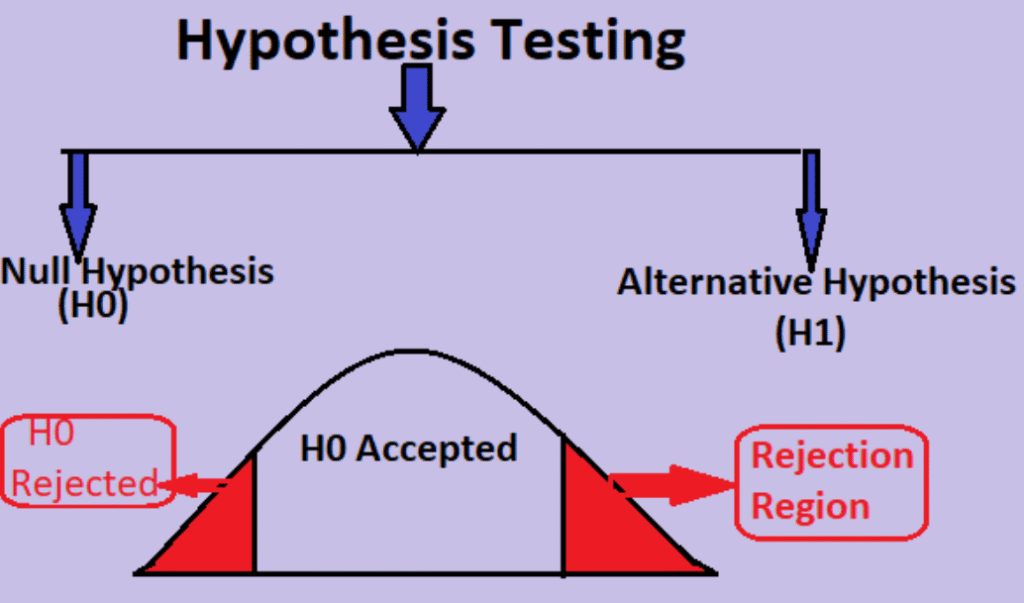
2. TYPES OF HYPOTHESIS TESTING (Common: Null & Alternative)
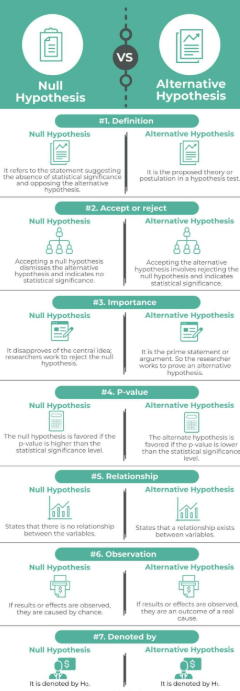
Null Hypothesis (H₀)
- A formal claim stating no difference, no effect, or no association in the population.
- It represents the baseline assumption and is tested against sample evidence.
- EXAMPLES FOR NULL HYPOTHESIS
- Mean: H₀: μ₁ = μ₂ (There is no difference in pain score between patients treated with Drug A and Drug B).
- Proportions: H₀: p₁ = p₂ (The proportion of diabetic patients is the same in rural and urban populations).
- Association: H₀: Variables are independent (Smoking status and lung disease are independent).
Alternative Hypothesis (H₁ / Hₐ)
- Represents the claim that a difference, effect, or association exists in the population.
- It is supported only when sample evidence is strong enough to reject H₀.
- EXAMPLES FOR ALTERNATIVE HYPOTHESIS
- Two-tailed: H₁: μ₁ ≠ μ₂ (The new drug reduces blood pressure differently than the standard drug).
- Right-tailed: H₁: μ₁ > μ₂ (A researcher wants to check if a new diet increases hemoglobin levels).
- Left-tailed: H₁: μ₁ < μ₂ (A hospital suspects their average fasting blood sugar is lower than the national standard of 100 mg/dL).
3. OTHER TYPES OF HYPOTHESIS TESTING
a) Simple Hypothesis
- Specifies the complete distribution of the population including all parameter values.
- Used when every component of the population parameter is fully defined (e.g., H₀: μ = 10, σ = 2).
b) Composite Hypothesis
- Does not fully specify the distribution; at least one parameter is unknown.
- Used when hypotheses involve a range or inequality (e.g., H₁: μ > 10).
c) One-tailed Hypothesis
- Specifies direction (greater or lesser).
- Used when theory predicts a specific directional effect.
d) Two-tailed Hypothesis
- Tests for any difference without direction.
- Used when deviation on either side is meaningful.
e) Point Hypothesis
- Specifies an exact value of a parameter.
- Used for precise equivalence testing.
f) Interval Hypothesis
- Specifies a range of parameter values.
- Useful in bioequivalence and quality control.
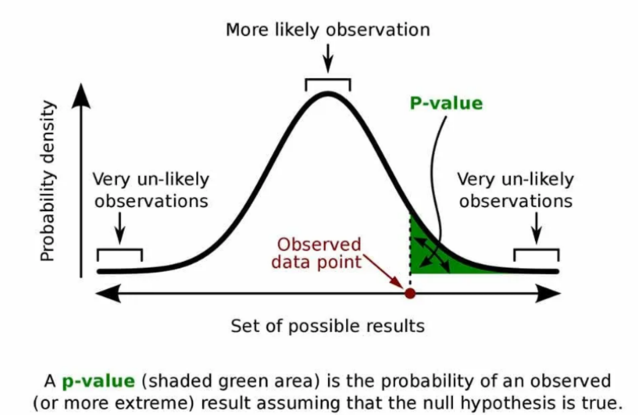
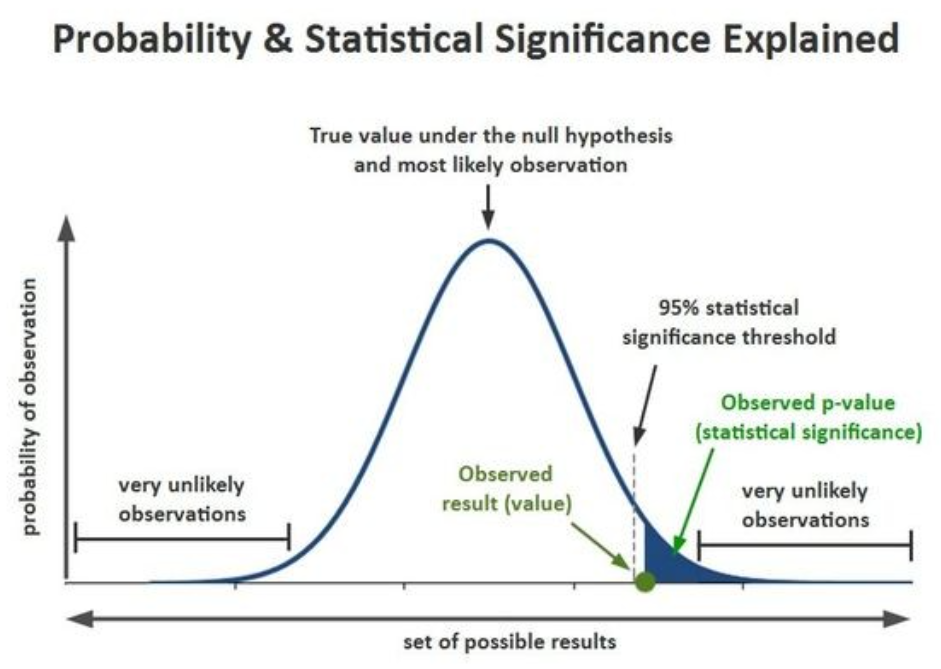
4. P-VALUE
- The p-value is the probability of obtaining a test statistic equal to or more extreme than the observed value, assuming the null hypothesis is true.
- It quantifies the strength of evidence against H₀.
- A smaller p-value indicates that the observed data is unlikely under H₀, leading to rejection of the null.
- It is used to measure statistical significance and guide decision-making.
5. EFFECT SIZE
- Effect size measures the magnitude of a difference or association, independent of sample size.
- While p-values show statistical significance, effect size shows the practical or clinical significance of the result.
- Common effect sizes: Cohen’s d, Odds Ratio, Risk Ratio, Pearson’s r.
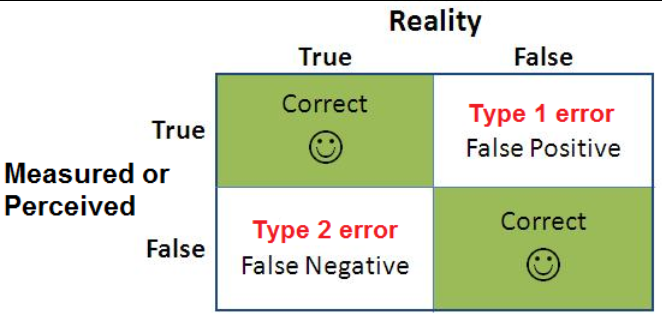
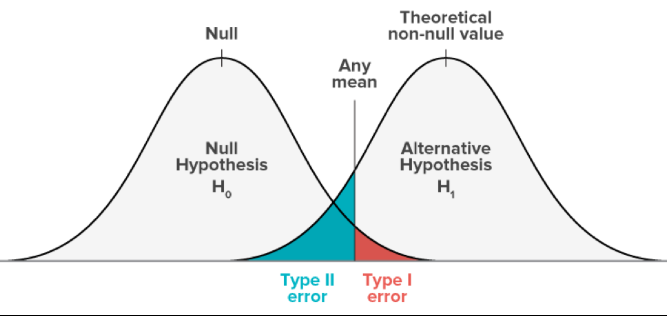
6. ERRORS IN HYPOTHESIS TESTING
Type I Error (α)
- Rejecting a true null hypothesis.
- Represents a false positive conclusion, controlled by the significance level.
- EXAMPLE : A new cancer screening test shows that a patient has cancer, but in reality, the patient is completely healthy. The test wrongly indicates a disease that is not present — a false positive result.
- INTERPRETATION: The hospital concludes that the new test is effective, but this conclusion is based on random error, not true disease detection.
Type II Error (β)
- Failing to reject a false null hypothesis.
- Represents a false negative conclusion, influenced by sample size and effect size.
- EXAMPLE : A diagnostic test shows that a patient does not have tuberculosis, but the patient actually does have TB. The test misses the disease — a false negative result.
- INTERPRETATION: The hospital fails to identify infected patients, leading to delayed treatment and increased health risk.
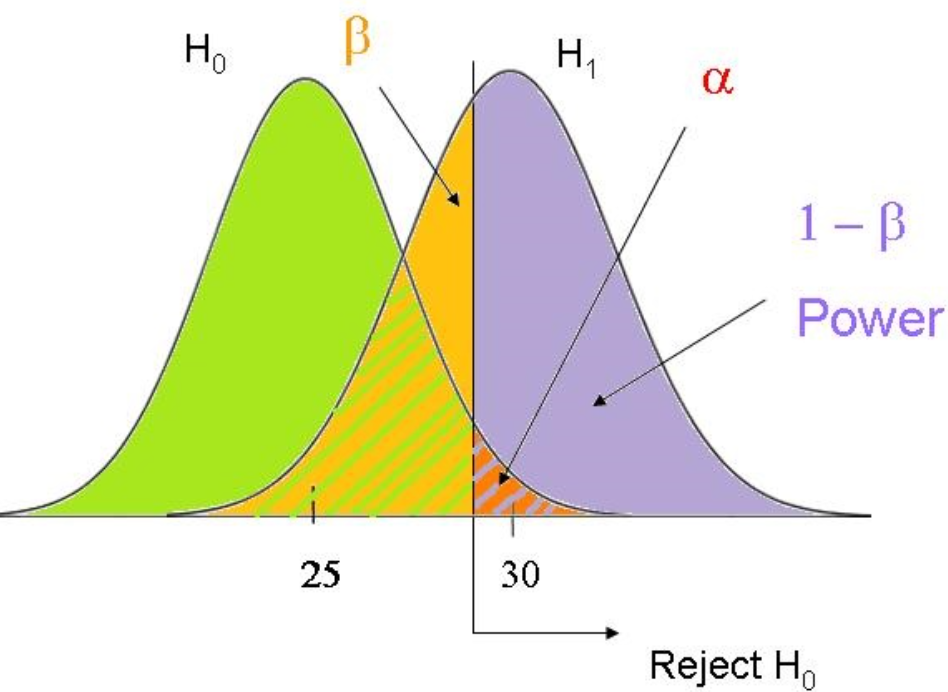
Significance Level (α)
- The significance level (α) is the maximum probability of making a Type I error, i.e., rejecting a true null hypothesis.
- It defines the cut-off point for deciding whether a result is statistically significant.
- Common choices are 0.05, 0.01, or 0.10, depending on how much risk of false positive you are willing to accept.
- EXAMPLE: If α = 0.05, a researcher accepts a 5% chance of wrongly concluding that a new drug works when it actually does not.
Power of a Test (1 – β)
- Power is the probability of correctly rejecting a false null hypothesis, meaning the ability of a test to detect a true effect when it actually exists.
- Higher power reduces the risk of a Type II error (β) and increases the reliability of study results.
- Power depends on sample size, effect size, significance level, and variability in the data.
- EXAMPLE: If a clinical study has 80% power, it means the study has an 80% chance of detecting a real difference in recovery time between two treatments, if such a difference truly exists.
7. ASSUMPTIONS CHECKING
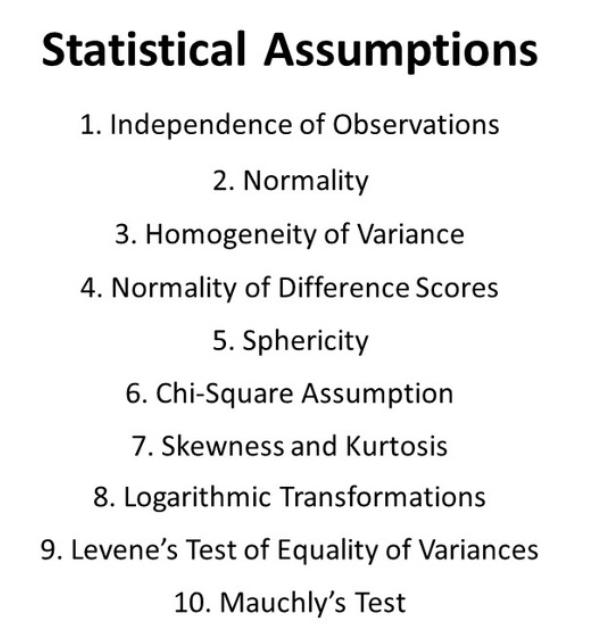
(This will be discussed in detail in a separate PDF.)
8. TEST STATISTIC:
- A test statistic is a numerical value calculated from sample data that summarizes the evidence against the null hypothesis.
- Each statistical test has its own formula (e.g., t-statistic, z-statistic, chi-square statistic), and the value is compared with the theoretical distribution under H₀ to determine the p-value.
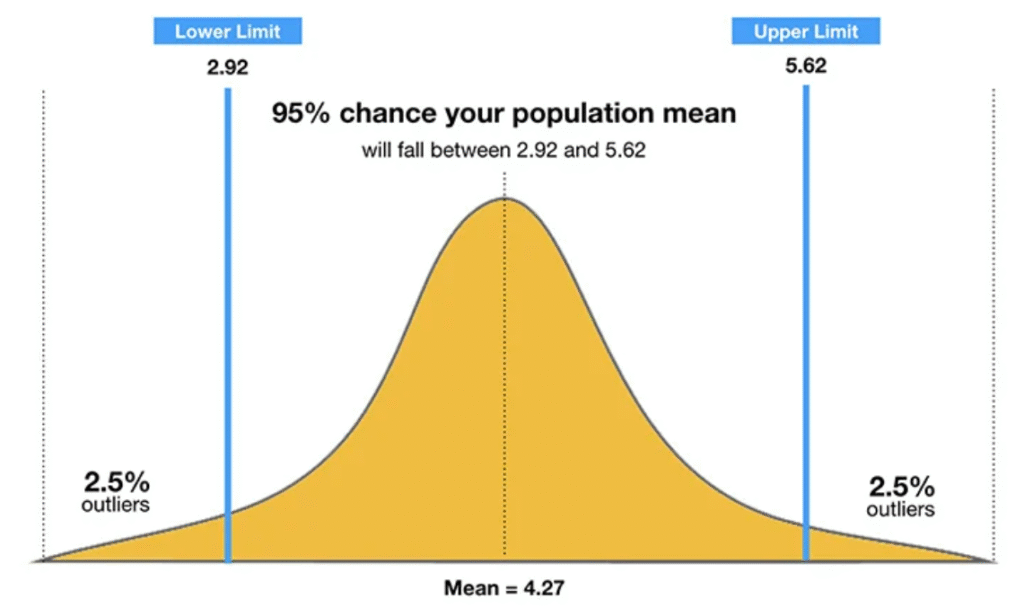
9. CONFIDENCE INTERVAL
- A confidence interval (CI) is a range of plausible values for a population parameter constructed using sample data.
- It provides an estimate of uncertainty and indicates how accurately the sample represents the population.
- CIs are used to express variability around estimates and are constructed using sample mean, standard error, and confidence level (e.g., 95%).
- They help assess both precision and practical significance.
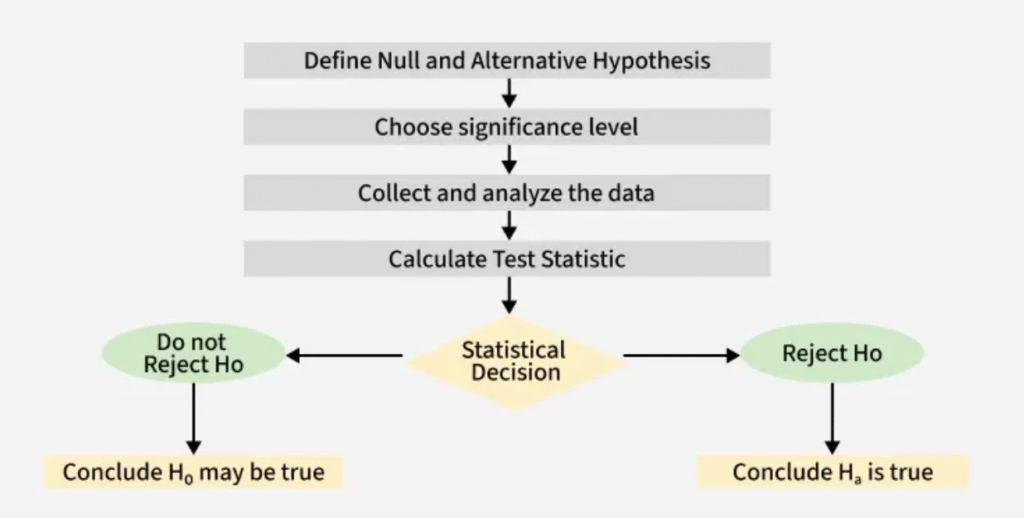
10. STEPS IN HYPOTHESIS TESTING
- State the null and alternative hypotheses:
- Define the research question in statistical form by specifying what you assume as baseline (H₀) and what you want to test (H₁).
- Choose the significance level (α):
- Select the acceptable probability of making a Type I error (usually 0.05, 0.01, or 0.10).
- Select the appropriate statistical test:
- Choose the test based on data type, number of groups, distribution, and study design (e.g., t-test, chi-square, ANOVA).
- Check required assumptions:
- Verify normality, independence, variance equality, scale of measurement, and sample size requirements.
- Compute the test statistic:
- Use the chosen statistical test formula to calculate the test statistic (e.g., t, z, χ², F).
- Determine the p-value:
- Find the p-value corresponding to the calculated test statistic under the null hypothesis distribution.
- Make Statistical Decision:
- Compare p-value with α:
- If p ≤ α → Reject H₀
- If p > α → Fail to reject H₀
- Compare p-value with α:
- Draw the conclusion based on evidence:
- Interpret the results in practical, clinical, or scientific terms (e.g., “The new drug significantly reduces blood pressure compared to standard treatment.”)
FINAL SUMMARY
| Component | Meaning | Purpose |
|---|---|---|
| Hypothesis Testing | Procedure to evaluate population claims | Decision-making |
| H₀ | No effect / No difference | Baseline assumption |
| H₁ | Effect / Difference exists | Research claim |
| p-value | Probability of data under H₀ | Evidence measure |
| α | Allowed Type I error | Cut-off for decision |
| β | Type II error | Chance of missing effect |
| Power | 1 − β | Detects true effects |
| Test Statistic | Numerical evidence from sample | Generates p-value |
| CI | Range of plausible values | Precision of estimate |
| Steps of Testing | H₀ → α → Test → Assumptions → Statistic → p → Conclusion | Process |
RELATED POST : https://mblstats.com/why-and-how-learning-statistics-is-useful-for-everyone/