Correlation :
It measures the Strength and direction of the relationship between two different variables
Examples : Age vs Blood Pressure , Height vs Weight , Study hours vs Exam marks
Autocorrelation:
It measures the relationship of a variable with itself over time
Examples : Stock prices today bs stock prices yesterday / Monthly disease incidence patterns
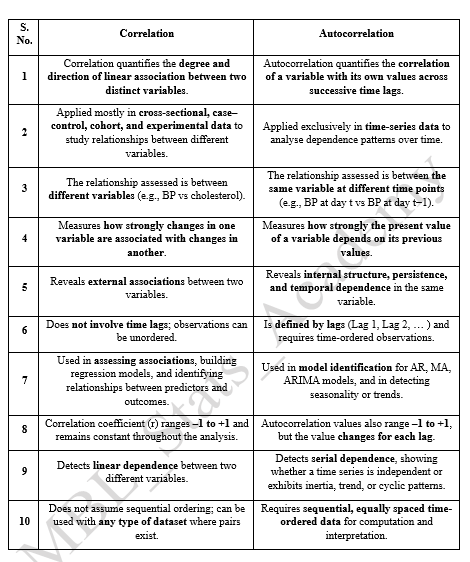
DIFFERENCE BETWEEN CORRELATION AND AUTOCORRELATION
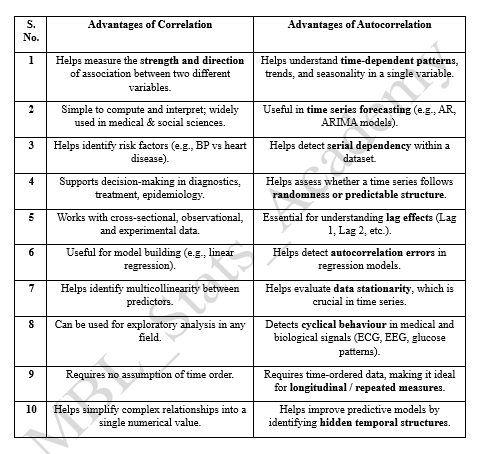
ADVANTAGES OF CORRELATION AND AUTOCORRELATION
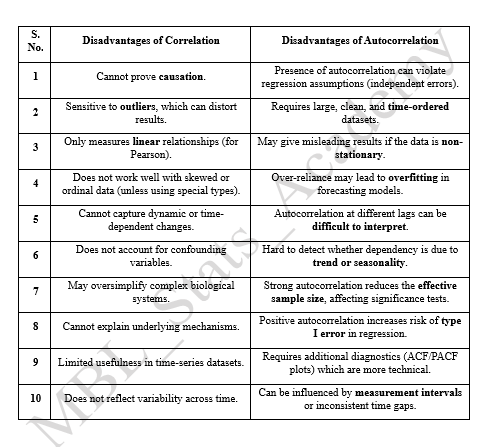
DISADVANTAGES OF CORRELATION AND AUTOCORRELATION
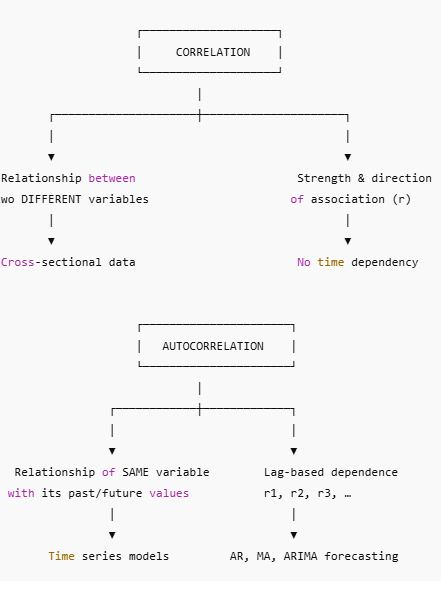
FLOWCHART
- Scenerio based examples for correlation : A Hospital wants to understand whether blood pressure (BP) is related to serum cholesterol levels among adults aged 30-60 years.
- If you see this, we are comparing BP and Cholesterol at the same point in time for each patient. We want to know whether both variables increase or decrease together.
Plot for correlation:
- Scenerio based examples for Autocorrelation: Daily blood glucose levels are recorded for a diabetic patient for 90 days. We want to know if today’s glucose levl depends on yesterday’s levels.
- If you see this , we are comparing the same variable (ICU admissions) with its previous values to detect patterns over time.
Plot for autocorrelation
OVERALL CONCLUSION
- Correlation and autocorrelation are powerful statistical tools that help us understand how variables behave and how they relate to each other.
- Correlation is used when we want to compare two different variables.
- For example, blood pressure and age, HbA1c levels and BMI, or inhaler use and asthma severity.
- When we see such data plotted in a scatter plot, we look for whether the points move upward together (positive correlation), downward together (negative correlation), or have no clear pattern (no correlation).
- We use correlation because it quantifies the strength and direction of these relationships, helping clinicians, epidemiologists, and researchers identify risk factors, predict outcomes, and make evidence-based decisions.
- On the other hand, autocorrelation is used when the focus is not on two variables, but one variable measured repeatedly over time—such as daily glucose readings, monthly hospital admissions, yearly disease incidence, or hourly heart rate signals.
- If we see the value at time t looking similar to the values at earlier times (t–1, t–2, etc.), we say the series has autocorrelation.
- We use autocorrelation to detect trends, seasonality, and internal patterns within time-ordered data.
- This is crucial in medical forecasting, such as predicting influenza outbreaks, monitoring ICU patient vitals, or modeling long-term chronic disease progression.
- In summary, correlation compares two different variables, while autocorrelation compares a variable with itself across time.
- Correlation helps us understand external relationships between factors, while autocorrelation helps us understand internal dynamics and time-based dependency.
- Together, they form the foundation for modern statistical analysis, prediction models, and medical decision-making, making them essential tools for researchers, clinicians, and data scientists.
To learn more about statistical testing, visit our guide on https://mblstats.com/hypothesis-testing-concepts-and-examples/

Proudly powered by WordPress